








Business description: AMSC ASA

Number of employees: 3
Sales by Activity: AMSC ASA
| Fiscal Period: December | 2020 (USD) | 2021 (USD) | 2022 (USD) | 2023 (USD) | 2024 (NOK) |
|---|---|---|---|---|---|
Offshore | - | - | 6.22M | - | - |
U.S Jones Act Tankers | - | - | 87.43M | - | - |
Shipbuilding | 88.2M | 88.19M | - | - | - |
Geographical breakdown of sales: AMSC ASA
| Fiscal Period: December | 2020 (USD) | 2021 (USD) | 2022 (USD) | 2023 (USD) | 2024 (NOK) |
|---|---|---|---|---|---|
United States | 88.2M | 88.19M | 93.65M | - | - |
Executive Committee: AMSC ASA
| Manager | Title | Age | Since |
|---|---|---|---|
| Chief Executive Officer | 54 | 01/01/2015 |
Composition of the Board of Directors: AMSC ASA
| Director | Title | Age | Since |
|---|---|---|---|
| Chairman | 68 | 18/06/2010 | |
Frank Ove Reite
BRD | Director/Board Member | 56 | 30/06/2011 |
| Director/Board Member | 69 | 07/03/2012 |
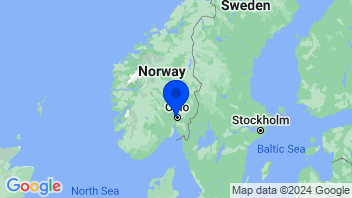
Company details: AMSC ASA
Group companies: AMSC ASA
| Name | Category and Sector |
|---|---|
ASC Leasing V, Inc. | |
ASC Leasing IV, Inc. | |
ASC Leasing II, Inc. | |
ASC Leasing VI, Inc. | |
ASC Leasing IX, Inc. |
Other Marine Freight & Logistics
| Change | 5-day change | 1-year change | 3-year change | Capi.($) | ||
|---|---|---|---|---|---|---|
 | +0.30% | -0.63% | +72.49% | +103.36% | 49.65B | |
| -0.66% | -0.30% | +25.57% | +109.70% | 36.54B | |
| +1.28% | +0.45% | +8.91% | -2.04% | 26.01B | |
| -1.78% | -2.79% | +105.90% | +170.84% | 21.07B | |
| -1.19% | +0.24% | +36.74% | +86.97% | 18.75B | |
| +0.57% | +1.35% | +41.78% | +143.52% | 17.46B | |
| +1.25% | -1.74% | +71.28% | +306.53% | 16.57B | |
| -1.20% | -0.98% | +61.33% | +79.63% | 16.19B | |
| -1.12% | -5.54% | +4.48% | +49.56% | 15.93B | |
| Average | -0.35% | +0.09% | +47.61% | +116.45% | 24.24B | |
| Weighted average by Cap. | -0.27% | -0.12% | +48.86% | +109.92% |


