








Business description: Tessi

Sales by Activity: Tessi
| Fiscal Period: December | 2019 (EUR) | 2020 (EUR) |
|---|---|---|
Tessi | 452M | 413M |
Geographical breakdown of sales: Tessi
| Fiscal Period: December | 2019 (EUR) | 2020 (EUR) |
|---|---|---|
France | 323M | 363M |
EMEA Excluding France | 114M | 37.4M |
South America | 14.9M | 11.8M |
Executive Committee: Tessi
| Manager | Title | Age | Since |
|---|---|---|---|
| Chief Executive Officer | - | - | |
Patrick Peillon
CMP | Compliance Officer | - | - |
| Comptroller/Controller/Auditor | - | - | |
Claire Mutel
LAW | General Counsel | - | - |
Benoit Bourg
HRO | Human Resources Officer | - | 01/04/2018 |
Company details: Tessi
Tessi SA à directoire et conseil de surveillance
14, rue des Arts et Métiers
38027, Grenoble Cedex
+33 4 76 70 59 10
http://www.tessi.fr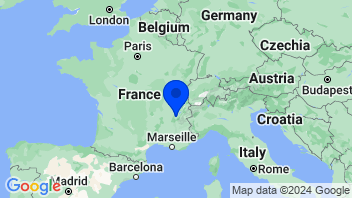
Group companies: Tessi
| Name | Category and Sector |
|---|---|
Tele Traitement Informatique SAS
 Tele Traitement Informatique SAS Data Processing ServicesTechnology Services Provides data processing, hosting and related activities |
Data Processing Services
|
Tessi Encaissements SAS
 Tessi Encaissements SAS Miscellaneous Commercial ServicesCommercial Services Provides business support activities |
Miscellaneous Commercial Services
|
Tessi GED SAS
 Tessi GED SAS Packaged SoftwareTechnology Services Develops software applications |
Packaged Software
|
Tessi TMS SAS
 Tessi TMS SAS Advertising/Marketing ServicesCommercial Services Operates an advertising agency |
Advertising/Marketing Services
|
Acces Informatique SARL
 Acces Informatique SARL Data Processing ServicesTechnology Services Specializes in data acquisition and management services |
Data Processing Services
|
Other IT Services & Consulting
| Change | 5-day change | 1-year change | 3-year change | Capi.($) | ||
|---|---|---|---|---|---|---|
 | -0.85% | -4.97% | -20.03% | +64.62% | 232B | |
| -3.94% | -6.77% | -10.93% | +0.85% | 176B | |
| -1.76% | +0.88% | +6.00% | -17.35% | 154B | |
| +2.35% | -9.87% | +4.95% | +72.89% | 97.24B | |
| +9.91% | -4.26% | +15.44% | +307.20% | 96.32B | |
| +0.11% | -0.16% | -16.49% | -25.87% | 96.17B | |
| -2.20% | +0.80% | -5.57% | +4.25% | 70.12B | |
| +1.20% | -0.30% | -20.00% | -15.87% | 50.9B | |
| +0.66% | +0.83% | -4.79% | +13.03% | 41.46B | |
| Average | +0.61% | -2.30% | -5.71% | +44.86% | 112.61B | |
| Weighted average by Cap. | -0.03% | -2.93% | -6.77% | +46.04% |


